CCI Historian, Control consulting, real-time data historian , data visualisation
CCi Historian - 70 million data points a second

Drag the time range from an hour to a year and the trend redraws before you've let go of the mouse. CCI Historian reads up to 70 million data points per second and runs its calculations on the fly — shift totals, OEE, efficiency curves and cost breakdowns are computed against raw history the moment you ask, not baked overnight into a summary table that's already stale.
No waiting for a report to run. No "that figure only updates at midnight."

CCI Historian: Process Historian with Python Analytics

Control Consulting CCI logo
Why CCI Historian?
  • Your periods, not the calendar's

    Group and total by shift, hour, day, week or month — or by batch, by job, by production run, by customer order, or any other identifier you already use. Shifts that start at 06:00, batches that don't respect midnight, jobs that span three shifts: CCI Historian aggregates against the boundaries your operation actually runs on, not the ones a calendar imposes.

    And because it calculates on the fly, changing the grouping is instant.

  • Python Analytics Gateway: CCI Historian (CCI Cake, by Control Consulting Inc) provides a gateway to Python analytics and machine learning either on its one or using data synchronised from an existing data historians on site. This allows power users to truly analyse the data captured when seeking to increase process efficiency and performance.

  • Cost-Effective: A simple, all-inclusive unlimited license with Enterprise pricing options for larger distributed applications. Powerful data collection and analytics tools in the hands of all site personnel, company wide.

  • Data: Read data from OPC, OPC UA, MODBUS, MQTT or other sources. CCI provides multiple options for data retrieval including ODBC, REST, OPC UA and OPC UA Historical Access.

  • Reliable: CCi Historian ensures high availability and robust performance, providing dependable data historisation. Store and Forward from the edge with a reverse connection (OT side initiates and IT never reaches in resulting in improved network security).

  • Agentic AI: Build dashboards by simply asking an agentic AI to perform the task. Simple tasks that take up your precious time can now be completed without the need for hours of training and product knowledge.

Energy Metering

Every screen below is a live Grafana dashboard reading straight from CCI Historian. The same data is equally available to Power BI, Excel or whatever reporting tool you already run — Grafana is one window onto your data, not a cage around it.

Your whole plant, live — with the history right beside it

A working process mimic of a milling and flotation circuit, from feed silo through cyclones to the rougher feed tank. Beside it sit the answers you'd normally go hunting for: pump run hours, daily volumes, and a run/stop timeline stretching back months — panned and zoomed at full resolution, without a loading spinner. Want those volumes per shift or per batch instead of per day? Change the grouping, not the data.

Ideal for: mining and mineral processing, water treatment, chemicals, food and beverage.

Advanced Data Analysis and Visualisation

Easy to use drag and drop charting.

With powerful analytical tools and intuitive visualisation capabilities, CCi Historian enables users to identify trends, optimise processes, and make data-driven decisions with confidence.

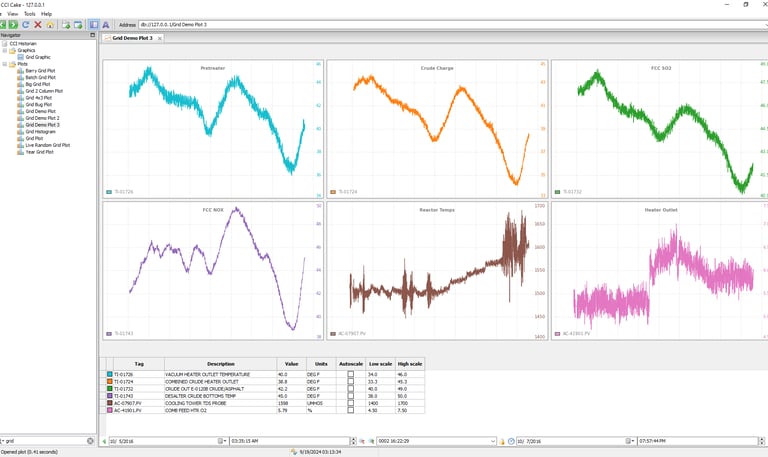
Data trends, histograms, data time shifting for process alignment, golden batch, support for MatplotLibs charts.

CCI Historian key features.
  • 70 million data points per second

  • Native Python scripting (calculation tags, Machine Learning & Analytics)

  • Replication for secure OT to IT data sharing

  • OPC UA Client and Server, OPC DA with tunnelling

  • ODBC connection for tools like Microsoft Power BI

  • Trending, XY, Histogram, Batch trends, Scooters with customisable analytics

  • Grafana support (uses Graphite connection)

  • Allows store and forward from multiple historian instances

  • Live graphic screens (support trends & Python charts)

Compatible with 64-bit Windows, Linux, and Raspberry Pi, CCi Historian supports both single-server and distributed deployments, effortlessly managing thousands of simultaneous clients.

CCI Historian trending and analysis screen
Production line OEE performance in CCI Historian
A few CCI Historian Dashboard Examples
CCI Historian Graphics

The pump is fine. The sump isn't.

Right now this pump is healthy: 239.9 m³/h, 65% efficiency, vibration steady. But two weeks of history underneath tell the real story — 990 minutes lost to low sump level across 67 separate events, almost 67% of all downtime, dwarfing everything mechanical. Cavitation, high bearing temperature and overcurrent are all there too, each ranked with its own mean time to repair. Condition monitoring that tells you whether to fix the pump, or fix the process feeding it.

Ideal for: Mining, water and wastewater utilities, chemical processing, irrigation, building services.

Energy metering report in CCI Historian
OEE Performance

Know what the electricity bill says before it arrives

Live time-of-use period, season and tariff rate, with demand headroom tracked against your notified maximum demand — and a month-to-date cost estimate broken down by every Megaflex charge category, recalculated on the fly rather than waiting for a month-end run. Split the same consumption by shift, by production line, or by batch to find out what a given product run actually costs to make.

Ideal for: manufacturing, mining, cold storage, water utilities and commercial property — anyone on a time-of-use tariff.

Industrial monitoring dashboard displaying real-time pump performance metrics including flow, head, and efficiency charts.
Pump Condition Monitoring

Every lost minute, accounted for:

Availability, Performance and Quality for the shift in progress, tracked against the target ramp so you know immediately if you're behind. The downtime Pareto and mean-time-to-repair figures recompute as the shift runs — not tomorrow morning. Shift patterns are yours to define, so the numbers line up with how the plant actually runs, and the same figures roll up by day, week, product or job without rebuilding anything.

Ideal for: Automotive and component assembly, packaging, FMCG, pharmaceuticals, plastics and extrusion.

CCI Historian process graphic example
CCi Charting Tool

Contact Us

Reach out for technical support or inquiries about CCi Historian.

Copyright 2026 AcuSYS Software Solutions (Pty) Ltd. All Rights Reserved.